
Suppose you have a running Java process and you would like to inspect its running status, for example how many object instance are created or memory consumption status, you can use some standard tool provided by JDK.
This blog is written based on JDK 1.8. The sample code I am using to simulate a endless running process:
package jmap;
class Tool{
private int count = 0;
public void Run() throws InterruptedException{
while(true){
System.out.println("Hello: " + this.count++);
Thread.sleep(5000);
}
}
}
public class JMapTest {
public static void main(String[] args) throws InterruptedException {
Tool tool = new Tool();
tool.Run();
}
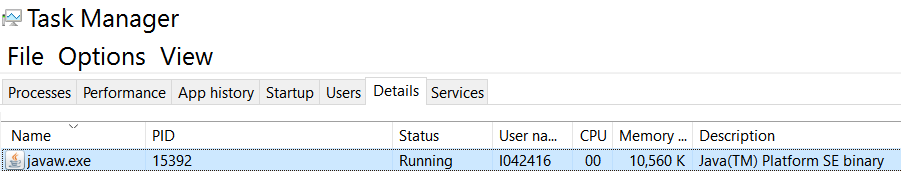
}(1) First get process id found in task manager: 15392
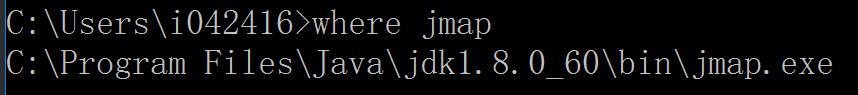
(2) use command line jmap -dump:format=b,file=c:\temp\heapstatus.bin 15392 jmap is a standard tool provided by JDK in this folder in my laptop:
heap bin file is generated now:

(3) Use another tool jhat to parse the bin file: jhat c:\temp\heapstatus.bin
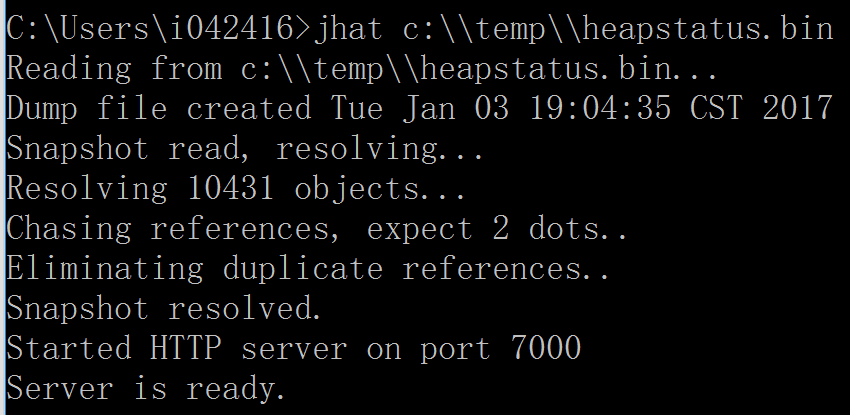
Then access localhost:7000 in browser:
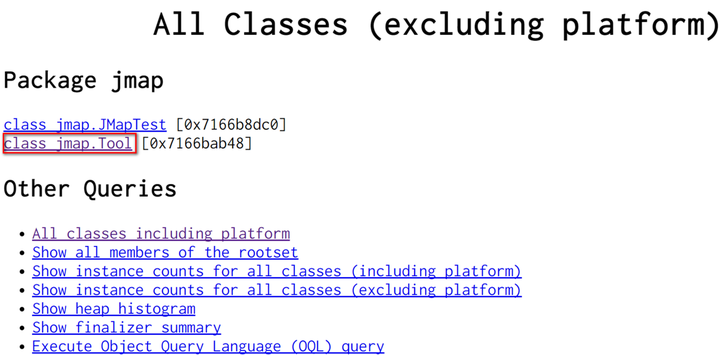
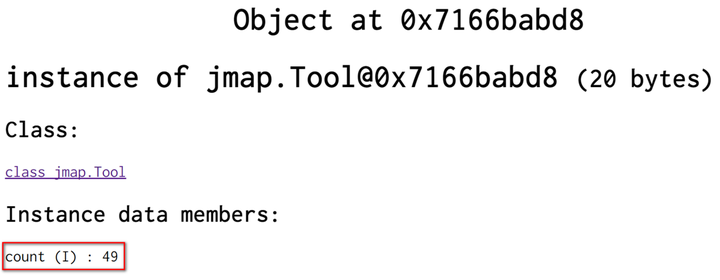
Click hyperlink class jmap.Tool, now I can find out that the instance of my tool class @0x7166babd8 has member attribute count with value 49.
(4) There is a plugin in Eclipse MAT – Memory Analyzer Tool which can achieve the same.
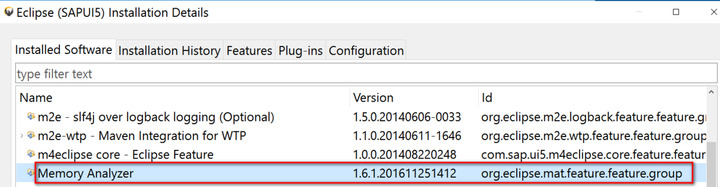
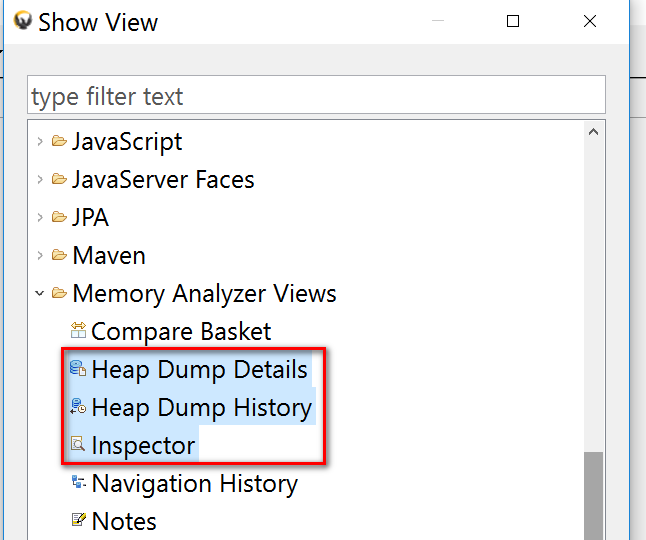
Once plugin is installed, you can make them visible in “Show View”:
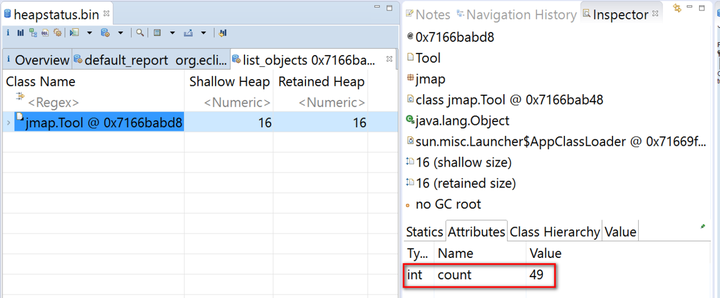
Drag your bin file into the view and the heap file will be parsed automatically. Click “Find object by address”:
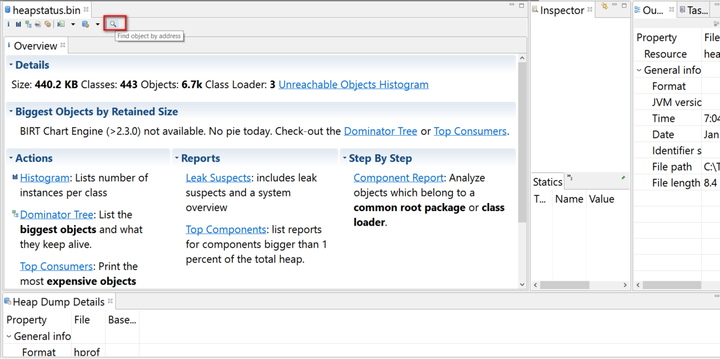
Type address of object instance you want to inspect:

You can get the same result as you get previously in localhost:7000
要获取更多Jerry的原创文章,请关注公众号"汪子熙":


相关推荐
MAT 是一个开源的java内存分析工具,能够快速的分析dump文件,可以直观的看到各个对象在内存占用的量...比传统的JDK分析工具jstat和jmap和Jhat更易用,更快速 适用于 java学习者,程序开发者调试java程序,分析BUG使用
- 第4章 虚拟机性能监控、故障处理工具- 4.2 基础故障处理工具JDK提供jhat(JVM Heap Analysis Tool)命令与jmap搭配使用,来
JDK本身提供了很多方便的JVM性能调优监控工具,除了集成式的VisualVM和jConsole外,还有jps、jstack、jmap、jhat、jstat等小巧的工具,下面这篇文章主要给大家介绍了关于jvm信息jmap使用的基本方法教程,需要的朋友...
常见虚拟机监控与故障处理工具的原理和使用方法。第三部分分析了虚拟机的执行子系统,包括类文件结构、虚拟机类加载机制、虚拟机字节码执行引擎。第四部分讲解了程序的编译与代码的优化,阐述了泛型、自动装箱拆箱、...
/ 76 4.2 JDK的命令行工具 / 76 4.2.1 jps:虚拟机进程状况工具 / 79 4.2.2 jstat:虚拟机统计信息监视工具 / 80 4.2.3 jinfo:Java配置信息工具 / 82 4.2.4 jmap:Java内存映像工具 / 82 4.2.5 jhat:...
性能监控工具与调优 2.5.1 jps 2.5.2 jstat 2.5.3 jinfo 2.5.4 jmap 2.5.5 jhat 2.5.6 jstack 2.5.7 jConsole 3. 多线程 3.1 线程的通信与状态转化 3.2 线程池及其实现 3.3 JUC 3.4 AQS 与 CAS 3.5 性能调优 4. 数据...
1、在 java 的 bin 目录下,jdk 提供了很多使用的工具,下面学习一些监控和故障处理的工具。 名称 作用 jps JVM process status tool,显示指定系统内所有的 HotSpot 虚拟机进程 jstat JVM statistics ...
第54节虚拟机工具-jhat详解00:08:10分钟 | 第55节虚拟机工具-jstack详解00:10:19分钟 | 第56节可视化虚拟机工具-Jconsole内存监控00:07:09分钟 | 第57节可视化虚拟机工具-Jconsole线程监控00:12:18分钟 | 第58节...
第54讲 虚拟机工具-jhat详解 00:08:10 第55讲 虚拟机工具-jstack详解 00:10:19 第56讲 可视化虚拟机工具-Jconsole内存监控 00:07:09 第57讲 可视化虚拟机工具-Jconsole线程监控 00:12:18 第58讲 死锁...
在windows服务器中tomcat以SYSTEM权限启动,JDK自带工具(jmap、jstack、jhat)无法正常使用 使用PsExec64.exe提升cmd权限 1. 将PsExec64复制到服务器 2. 运行cmd命令: PsExec64.exe /s cmd 如果不成功,则执行下条...
Windouws 64 位Tomcat7.0.40 + 64位jdk1.7.0u21 绿色版 part1 纯绿色,官方下载,绝对可用~ 欢迎评论吐槽~ 文件 PATH 列表 │ LICENSE │ NOTICE │ RELEASE-NOTES │ RUNNING.txt │ ├─bin │ bootstrap.jar │...